How much free capacity has my 3PAR got? This seems like a simple question but I see lots of questions about it. The SSMC has simplified viewing the 3PAR capacity information significantly so lets start there .
SSMC
RAW CAPACITY
When you open the 3 PAR SSMC you will see the dashboard view. In the dashboard you will see a number of widgets that will help you with your 3PAR capacity management, the widgets are as follows:
Total capacity – This shows you the total raw capacity. For clarity this raw capacity is just the sum of the capacity of all the disks in your system and takes no account of RAID levels, sparing etc.
Device Type Capacity – This again measures raw space but this view allows you to see it by device type i.e. the type of disk be that FC, NL or SSD
Allocated capacity – Another raw figure, this takes the total capacity allocated which means used and shows you what it is using up the space dividing it up by block, file and system
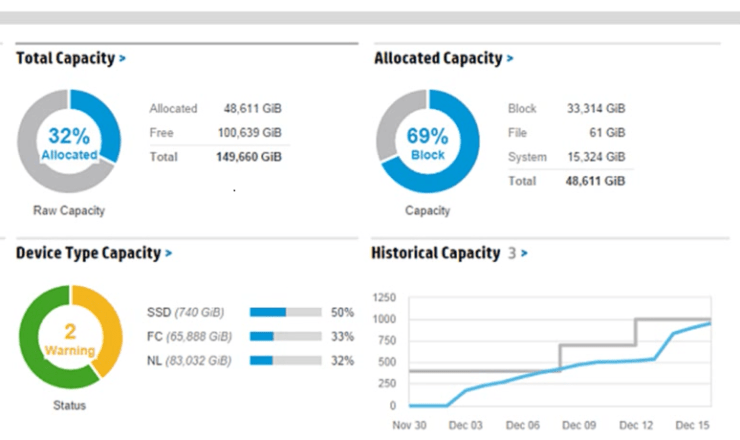
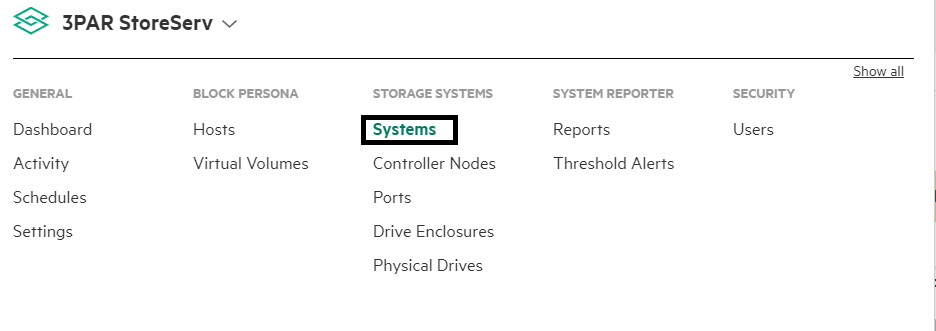
The above widgets show the capacity for ALL systems connected to SSMC, to see the capacity information for a single system click on the widget in the dashboard. You can also drill down to the capacity for a single system by opening the main menu, and then choosing systems, then choosing the capacity view.
USEABLE CAPACITY
The capacity measures we have looked at so far have shown raw space available in different ways. Potentially the figure you will be most interested in will be how much space is actually available to be written to i.e. what is the useable space. For this we need to look at the CPG level
From the main menu choose Common Provisioning Groups. If you cannot see this option choose show more from the top right
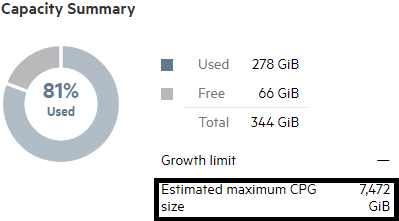
In the left hand pane choose the CPG you are interested in checking the available space for. In the right hand window look at the Capacity Summary widget. When you look at this you will probably look at the free figure and see there is not much space left. Once you finish nearly having a heart attack thinking you are about to run out of space, let me reassure you that this figure is highly misleading. CPG’s grow on demand and this figure will always show a small amount of free space.
The figure you are really interested in is the Estimated maximum CPG size. This is the figure that shows the useable capacity available to the 3PAR. Be mindful that multiple CPG’s can consume space from the same set of physical disks, check out our CPG Overview if you need a refresher on this.
COMMAND LINE
If you are a command line junkie you can get exactly the same stats from the CLI. To view get a similar view of disk capacity utilisation as in part 1 run
showsys – space
To view writeable capacity left on a CPG as in part 2 run the below, the figure you are interested in is LD free
showspace -cpg cpgname
Posted from: https://d8tadude.com/2014/07/31/viewing-free-capacity-in-3par/